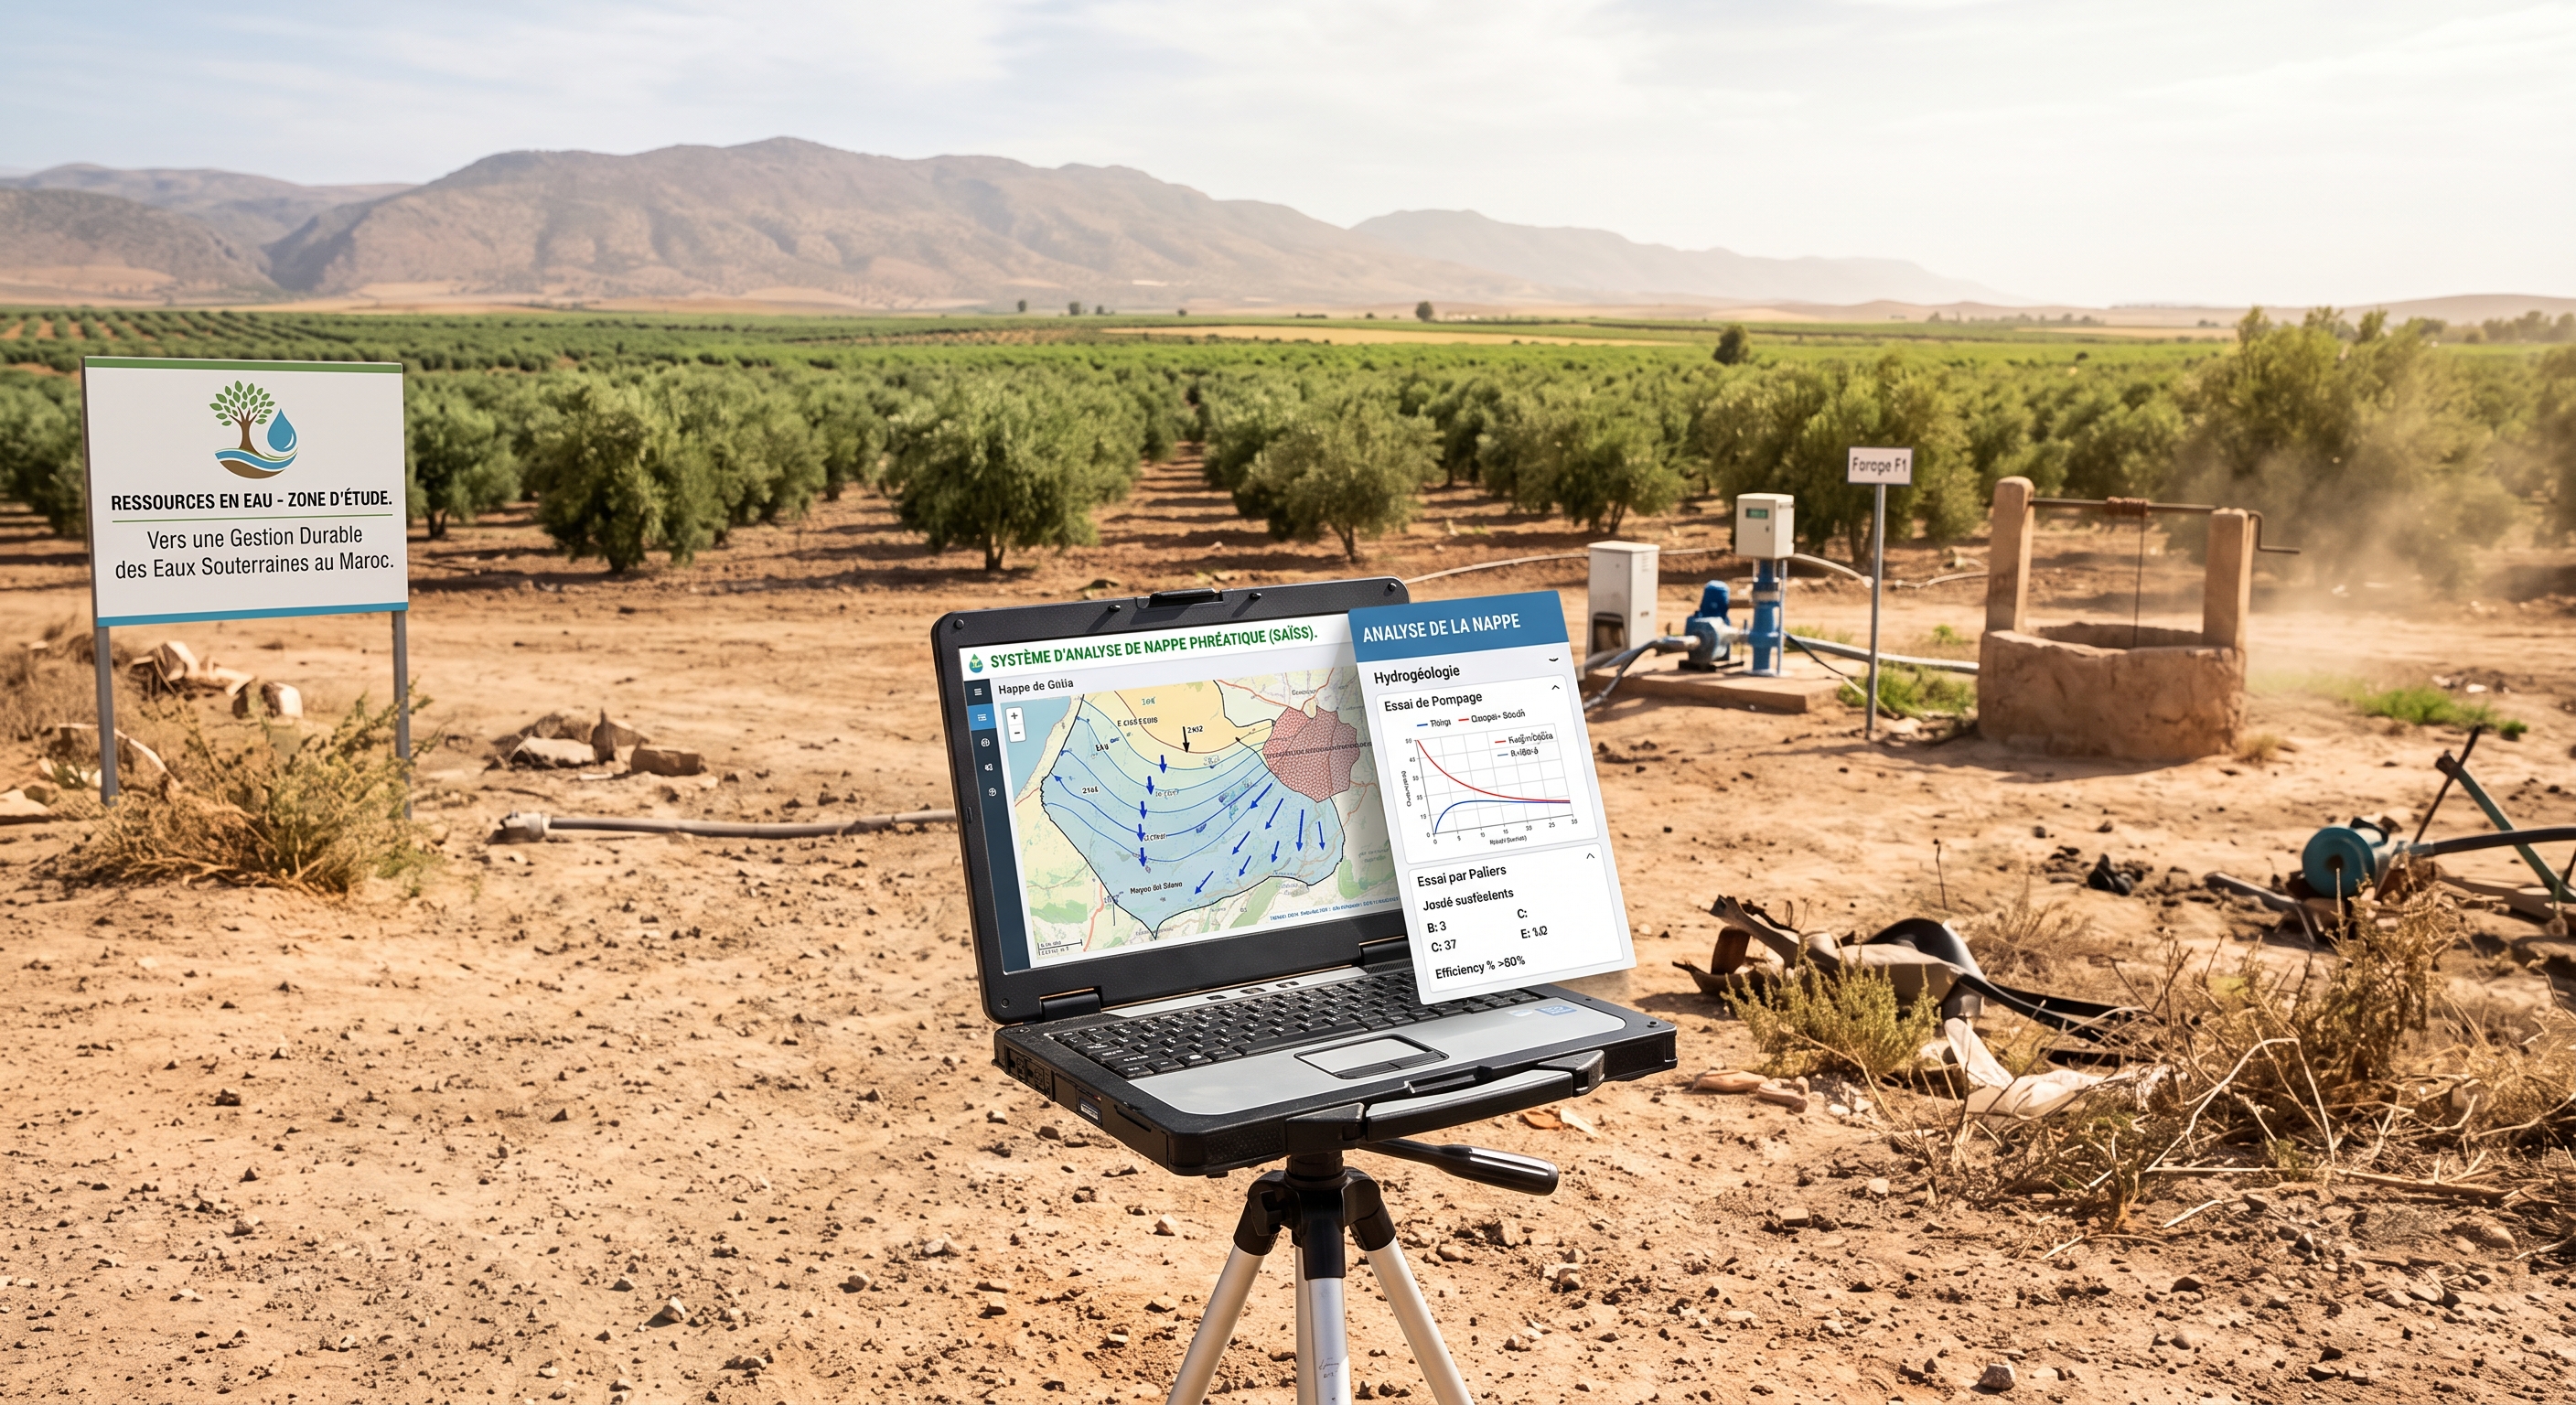
Tools for Aquifer Analysis
Ali HAMMANI
August 31, 2026 • Updated August 31, 2026
Groundwater in Morocco: a strategic resource under heavy pressure
In Morocco, groundwater covers an essential share of drinking-water supply, irrigation and industrial activity, particularly in areas where the irregularity and growing scarcity of rainfall limit the availability of surface water. The country's major aquifers (Saiss, Souss-Massa, Haouz, Tadla, Berrechid, Bahira, the Rif and Oriental plains, among others) have for several decades been subject to abstraction pressure that often exceeds their renewal capacity, driven by the combined effect of irrigation expansion, urban growth and recurring drought episodes intensified by climate change. This overexploitation translates concretely into a continuous decline in piezometric levels, the drying-up of traditional springs and wells, localized degradation of water quality (salinization, seawater intrusion along the coast) and, in some basins, a risk of irreversible depletion of reserves.
Faced with these challenges, the National Water Plan and the groundwater-management strategies implemented by the Hydraulic Basin Agencies (Agences de Bassins Hydrauliques) all rest on the same prerequisite: having detailed, up-to-date knowledge of each aquifer's hydrogeological behaviour (geometry, hydrodynamic parameters, piezometric levels, inflow/outflow balance) so that management decisions — aquifer contracts, abstraction permits, protection perimeters — can be grounded in reliable data rather than approximations. Yet in many areas this knowledge remains fragmented across one-off study reports, scattered field measurements and non-shared calculation tools, which hampers continuous monitoring of aquifers and the capitalisation of data from one pumping test to the next.
It is in this context that Genie-Rural.ma is developing integrated digital tools that let engineers, hydrogeologists and water-resource managers build, test after test, a geolocated and shareable knowledge base on Moroccan aquifers — a necessary step to move from reactive management toward forward-looking, sustainable groundwater management.
Comprehensive mapping tools for aquifer analysis
The Genie-Rural.ma platform has just enriched its Pumping Test module (pumping_test) with a dedicated panel, Aquifer Analysis, accessible directly from the interactive map. This panel brings together, in a single workspace, everything a hydrogeology engineer needs to characterize an aquifer, interpret a pumping test and diagnose the performance of a well — without leaving the map.
It is organized into three complementary sections, each covering one stage of the hydrogeological diagnosis: Aquifer Hydrology, Pumping Test and Step-Drawdown Test.
1. Aquifer Hydrology
This section is used to build, on the map, a complete geometric and hydrodynamic model of the aquifer under study — a prerequisite for any pumping-test interpretation:
- Aquifer geometry: the aquifer's extent can be digitized directly on the map, imported from a GeoJSON file, selected interactively on the map, or retrieved from a list of Morocco's aquifers already referenced in the platform. Once the geometry is defined, its attributes (name, lithology, aquifer type...) and its styling can be edited from dedicated modals.
- WaPOR data: WaPOR satellite layers (evapotranspiration, precipitation, biomass, etc.) can be overlaid on the aquifer, with a choice of variable and date, to put the area's water balance in context and support the analysis of water inflows/outflows.
- Inflow/outflow boundaries and leakage boundary: the aquifer system's boundary conditions (imposed fluxes, exchanges with an adjacent aquifer through leakage) are digitized as independent linear objects, each with its own map styling, to document the modelling assumptions used (unconfined, confined, semi-confined aquifer...).
- Topography and aquifer bottom elevation: topographic points (imported from CSV, Excel or GeoJSON) and bedrock/bottom-elevation points are automatically interpolated using kriging/IDW (inverse-distance-weighted interpolation) to generate a Digital Elevation Model (DEM), contour lines and a 3D surface view. The difference between the ground surface and the aquifer bottom directly provides an estimate of the saturated/total aquifer thickness at any point.
- Groundwater level (piezometry): each piezometer is entered with its measured depth or piezometric level; measurements are imported or edited manually and then interpolated to produce depth/level rasters, isopiestic contour lines and dated 3D surfaces (one piezometric map per measurement campaign). From these surfaces, the tool automatically computes streamlines (flow directions perpendicular to the isopiestic contours), hydraulic gradients along user-drawn profiles, and the hydraulic flux crossing a given section, via Darcy's law applied to the piezometric gradient and the aquifer's transmissivity: $$ q = -T \, \frac{dh}{dl} $$ where \(q\) is the unit discharge per unit width, \(T\) is the transmissivity, and \(dh/dl\) is the piezometric gradient along the profile.
2. Pumping Test
This section drives the complete management of pumping tests carried out on the aquifer and their quantitative interpretation:
- Test organization: several pumping tests can be created within the same aquifer project, each associated with a pumping well and one or more observation wells positioned on the map, along with their distance to the pumped well (parameter r) and the constant pumping rate Q.
- Drawdown measurement input: time/drawdown pairs (and, where available, recovery measurements taken after pumping stops) are entered or imported for each well, then managed from a dedicated workspace.
- Theis method (transient regime, confined aquifer): the observed drawdown curve is fitted by non-linear (least-squares) regression to the Theis equation $$ s(t) = \frac{Q}{4\pi T} \, W(u), \qquad u = \frac{r^2 S}{4 T t} $$ where \(W(u)\) is the well function (exponential integral). The fit directly yields the transmissivity \(T\) and the storativity \(S\) of the aquifer, with a confidence interval computed from the covariance matrix of the estimation.
- Cooper-Jacob method (logarithmic approximation of Theis, valid for sufficiently long times / small \(u\)): drawdown is plotted against the logarithm of time; the slope of the line fitted by linear regression gives the transmissivity, and its intercept at the origin (time \(t_0\) for which \(s = 0\)) gives the storativity: $$ T = \frac{2.3\,Q}{4\pi \, \text{slope}}, \qquad S = \frac{2.25\, T\, t_0}{r^2} $$ This simpler graphical method is offered alongside Theis for transient-regime tests on confined aquifers.
- Recovery analysis: after pumping stops, the residual drawdown is plotted against \(\log(t/t')\) (\(t\) = time since pumping started, \(t'\) = time since pumping stopped). The slope of the recovery line, fitted by linear regression, is used to recompute the transmissivity independently of well losses, providing a cross-check of the results obtained during the pumping phase.
- Goodness of fit and results: each method returns the coefficient of determination (R²), a confidence level on the estimated parameters, and the observed curve overlaid on the fitted theoretical curve, all viewable and exportable from the results modal.
3. Step-Drawdown Test
This section is dedicated to diagnosing the well's own hydraulic performance, independently of the aquifer, through a test at increasing discharge rates:
- Test organization: a step-drawdown test groups several increasing discharge steps carried out successively on the same well, each characterized by its pumping rate
Qand its stabilized drawdownsat the end of the step. - Jacob's method (linear + quadratic well losses): for each step, the specific drawdown \(s/Q\) is calculated, then linearly regressed against the discharge \(Q\) using Jacob's relation: $$ \frac{s}{Q} = B + C \, Q $$ The regression provides:
- coefficient \(B\) (linear well loss), reflecting aquifer losses (laminar flow toward the well);
- coefficient \(C\) (quadratic well loss), reflecting losses specific to the well itself (turbulent flow through the screen and casing, clogging, well deterioration);
- the coefficient of determination \(R^2\) of the fit, an indicator of diagnostic reliability.
- Well efficiency per step: from \(B\) and \(C\), the tool automatically computes, for each tested discharge rate, the share of total drawdown attributable to the aquifer versus losses specific to the well itself: $$ \text{efficiency} (\%) = \frac{B \, Q}{B \, Q + C \, Q^2} \times 100 $$ which helps identify the optimal operating discharge rate and detect potential clogging or damage to the well.
- Management and results: incomplete or invalid steps (zero discharge, no stabilized drawdown) are automatically excluded from the calculation and flagged, while detailed results (B, C, R², per-step efficiency) remain available in a dedicated step-drawdown workspace.
Available now on genie-rural.ma
These aquifer-analysis tools are deployed and available to all users of the Pumping Test module on https://genie-rural.ma. They are part of the platform's broader effort to offer Moroccan engineers and hydrogeologists integrated mapping tools, from field data to interpretation, for a finer-grained management of groundwater resources.
Discussion
Join the conversation
Join the discussion
Sign in to share your thoughts
No comments yet
Be the first to share your thoughts on this article!